
Hello, everyone. My name is Daichi, an expert providing the information about the radiation issues in an easy-to-understand manner.
Today, I would like to respond to the following questions:
– How much environment contamination occurred after the accident of the Fukushima Daiichi NPP?
– How has it changed over time?
Table of contents of this article
- Environmental contamination caused by the accident of the Fukushima Daiichi NPP (Vol. 1)
- Change of air dose rate with time (East Japan)
- Change of air dose rate with time (Vicinity of the Fukushima Daiichi NPP)
- What can be found out from results of airborne monitoring?
- Contamination spreads from Tohoku to Kanto
- Air dose rate decreases as a whole with time
- Reduction rate of air dose rate is large in areas with high dose rate
- Air dose rate becomes higher when it comes closer to the NPP and lower when it comes farther from the NPP, but there are a lot of exceptions
- Reduction rate of air dose rate decreases with time
- Summary
I have been involved with the radiation-relevant issues, like the policy on the decontamination activities, after the accident of the Fukushima Daiichi Nuclear Power Plant in 2011.
I received a doctorate in the field of radiation, while working in Fukushima.
- Environmental contamination caused by the accident of the Fukushima Daiichi NPP (Vol. 1)
- Change of air dose rate with time (East Japan)
- Change of air dose rate with time (Vicinity of the Fukushima Daiichi NPP)
- What can be found out from results of airborne monitoring?
- Contamination spreads from Tohoku to Kanto
- Air dose rate decreases as a whole with time
- Reduction rate of air dose rate is large in areas with high dose rate
- Air dose rate becomes higher when it comes closer to the NPP and lower when it comes farther from the NPP, but there are a lot of exceptions
- Reduction rate of air dose rate decreases with time
- Summary
Environmental contamination caused by the accident of the Fukushima Daiichi NPP (Vol. 1)
After the accident of the Fukushima Daiichi Nuclear Power Plant, although air dose rate varies from point to point, wide range of areas, from the Tohoku to the Kanto area, were contaminated by radioactive materials released into the environment.
In the following sections, change of air dose rate over time in East Japan, as well as in the area in the vicinity of the damaged Fukushima Daiichi Nuclear Power Plant are shown individually.
By the way, these figures are created based on the information in this site (in Japanese) of air-borne monitoring implemented by the Nuclear Regulation Authority.
Therefore please visit this site for the detail information about the air-borne monitoring.
Change of air dose rate with time (East Japan)
Results of air-borne monitoring over the East Japan are available, starting from the results of June 2012, when around 1 year and 3 months passed after the accident.
As shown in the legend, red area represents high air dose rate, and it decreases from high to low: orange, green to blue.
Partially white areas can be observed, but they represent areas where air dose rate was not able to be monitored(e.g. due to snow).
After the accident, methodology for monitoring, as well as approach for evaluation have been improved, as time has proceeded, therefore, it might be better to see general change or tendency of change of air dose rate, instead of focusing on change of too much small/local areas.
What can be observed from results of the around 12-year monitoring projects are summarized in the last part of this article.
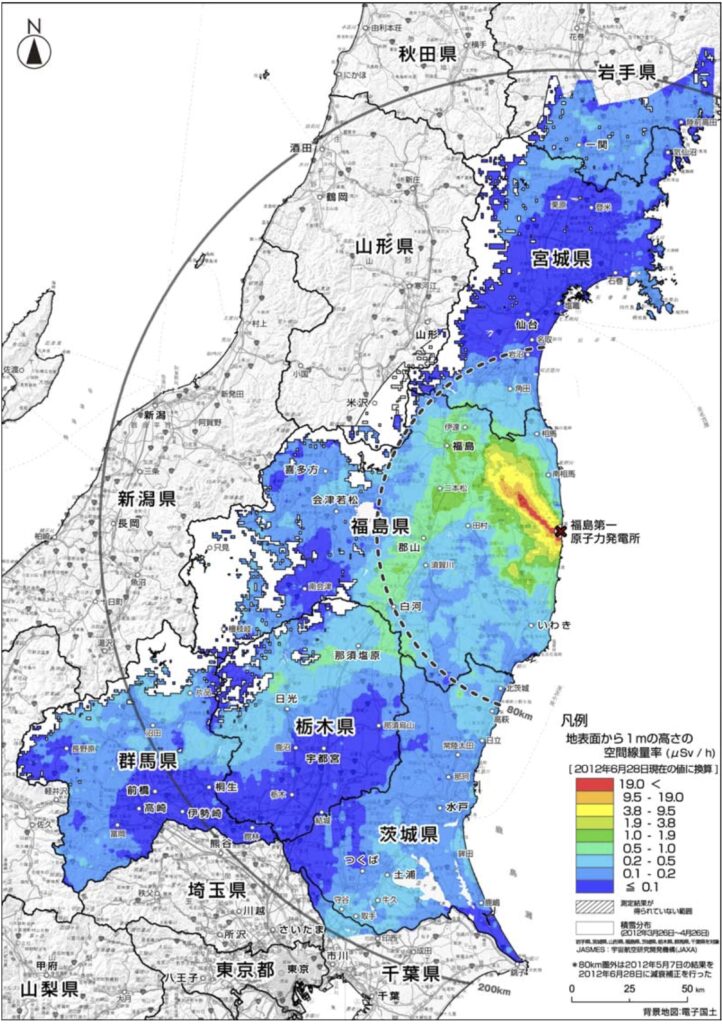
↑ 28 Jun. 2012
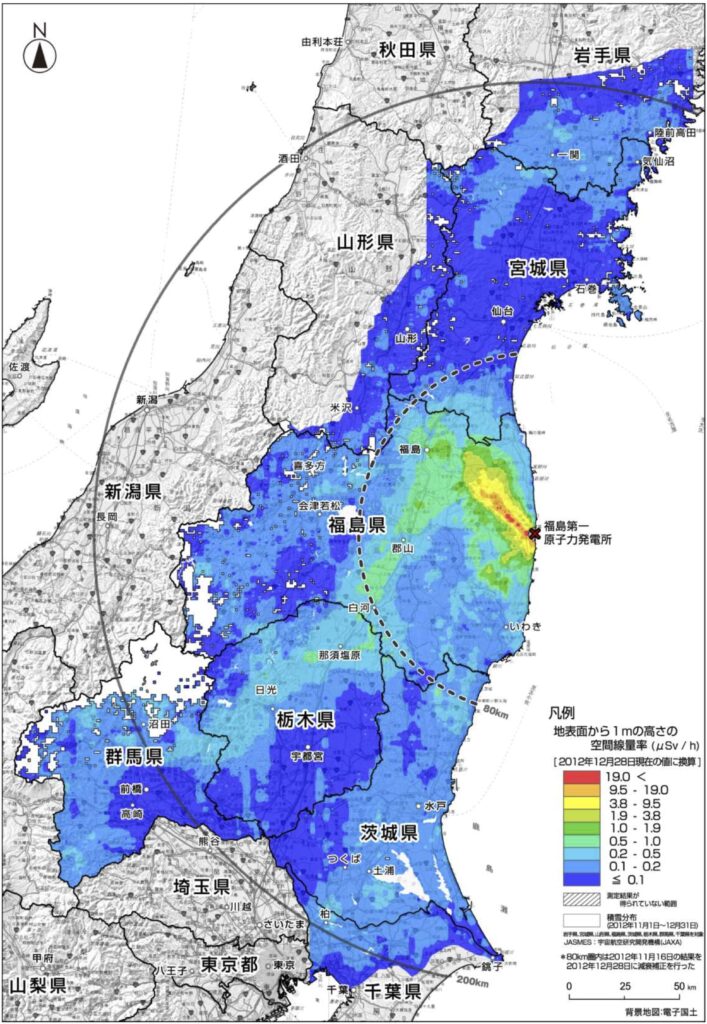
↑ 28 Dec. 2012
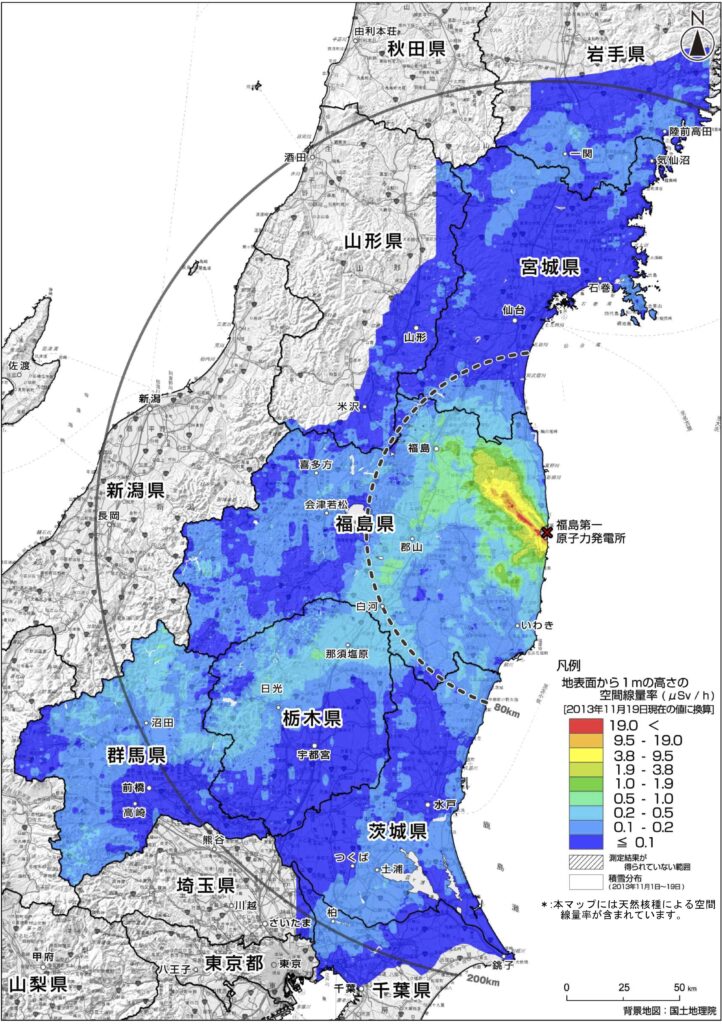
↑ 19 Nov. 2013

↑ 7 Nov. 2014
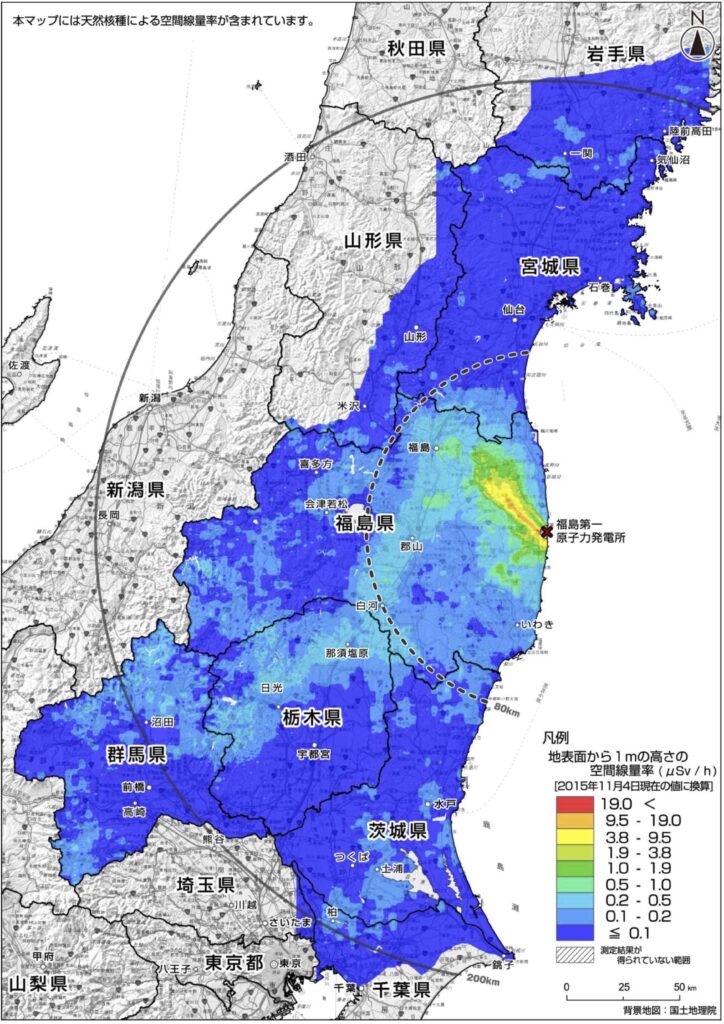
↑ 4 Nov. 2015

↑ 18 Nov. 2016
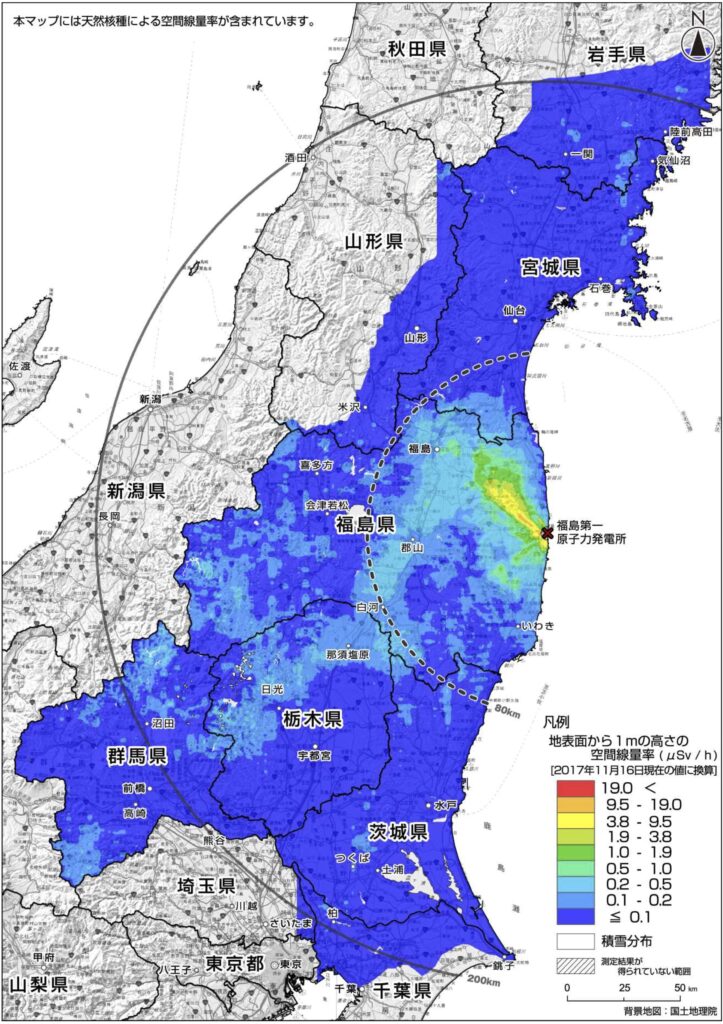
↑ 16 Nov. 2017
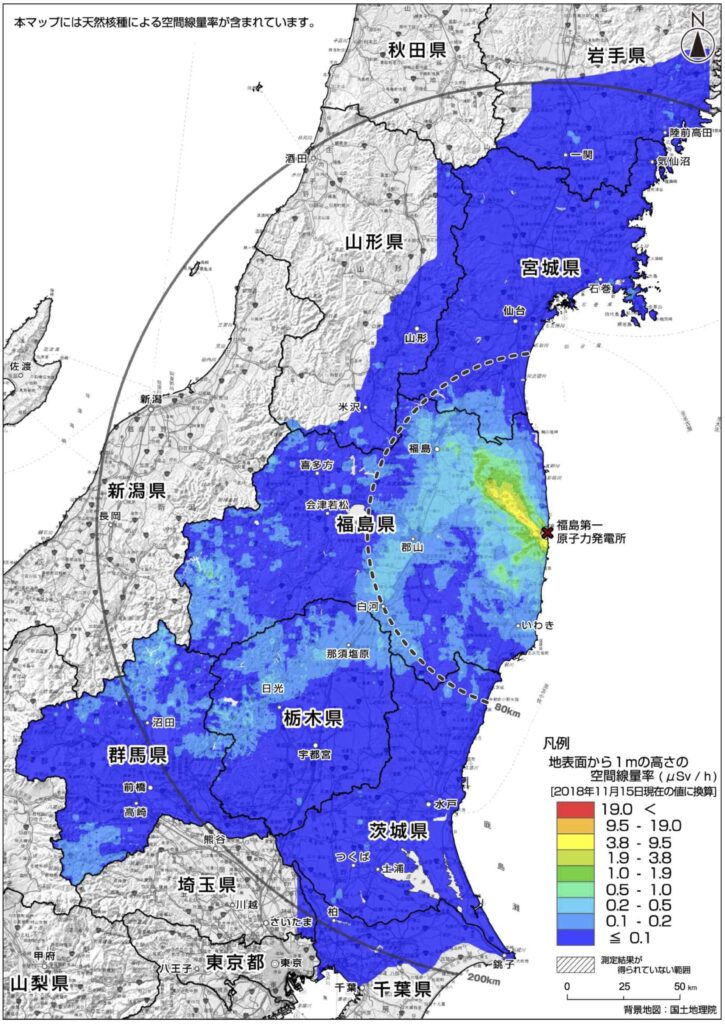
↑ 15 Nov. 2018
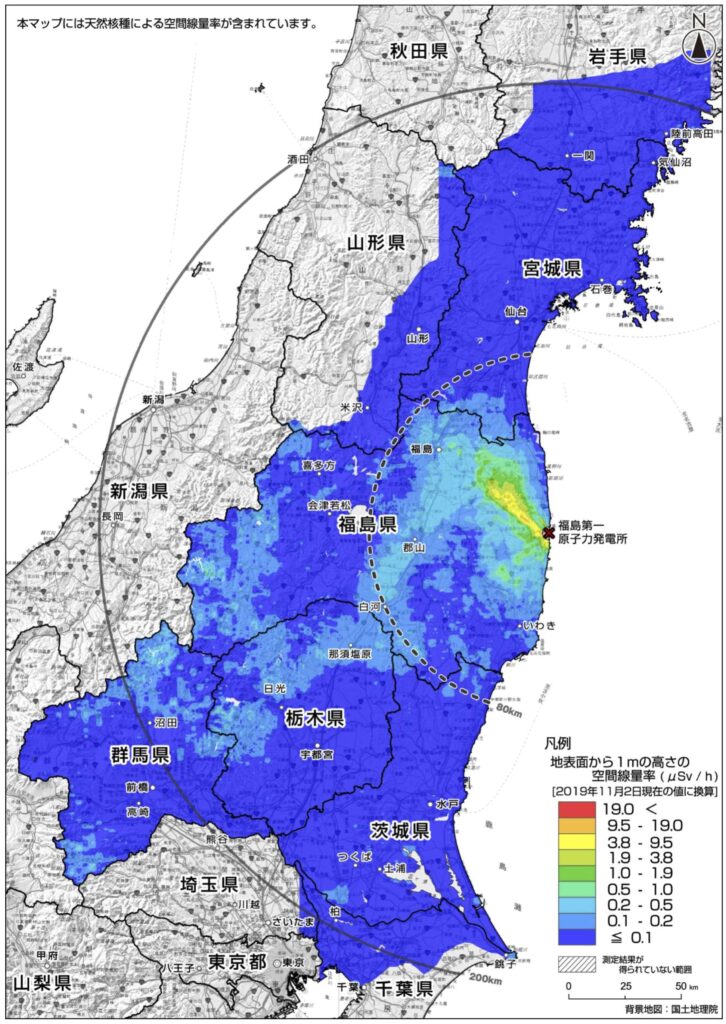
↑ 2 Nov. 2019
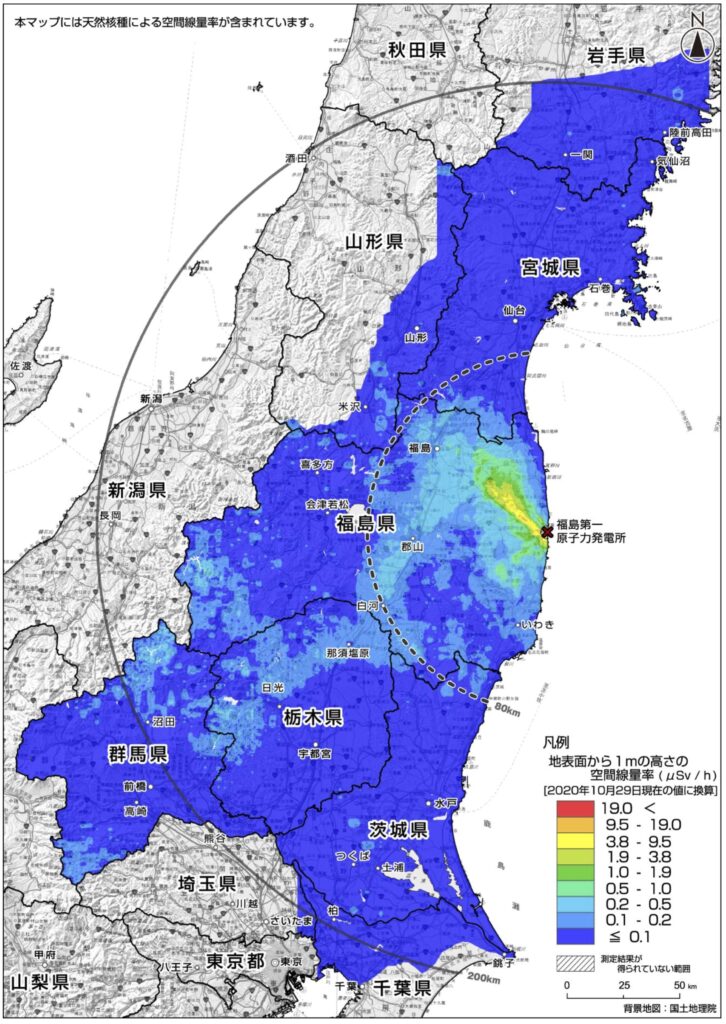
↑ 29 Nov. 2020

↑ 25 Oct. 2021
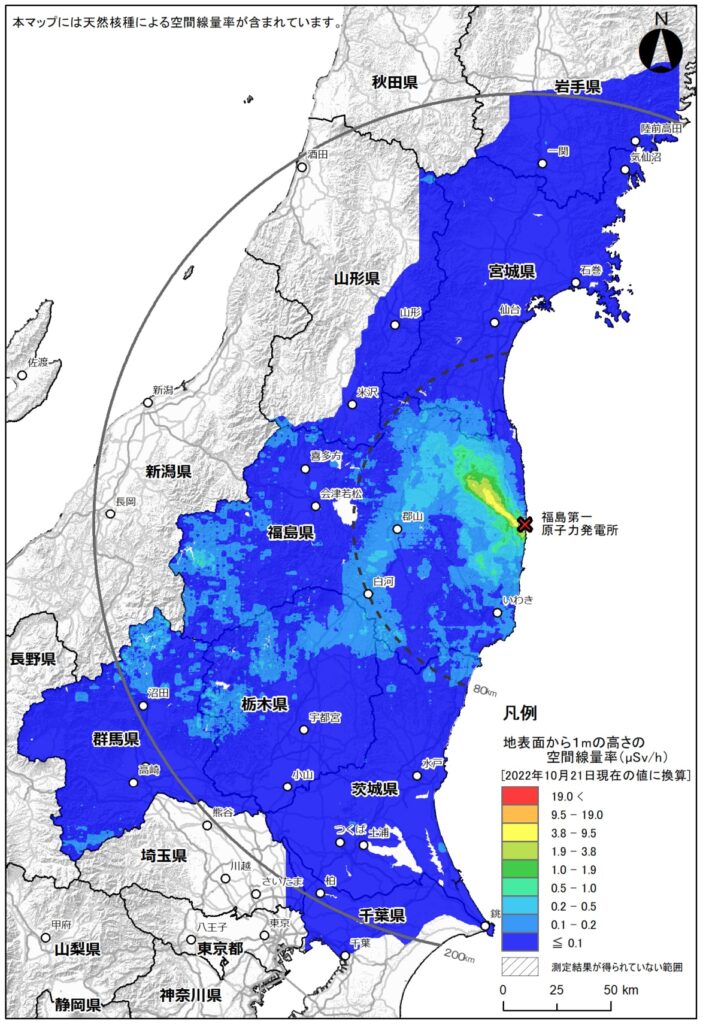
↑ 21 Oct. 2022

↑ 27 Nov. 2023
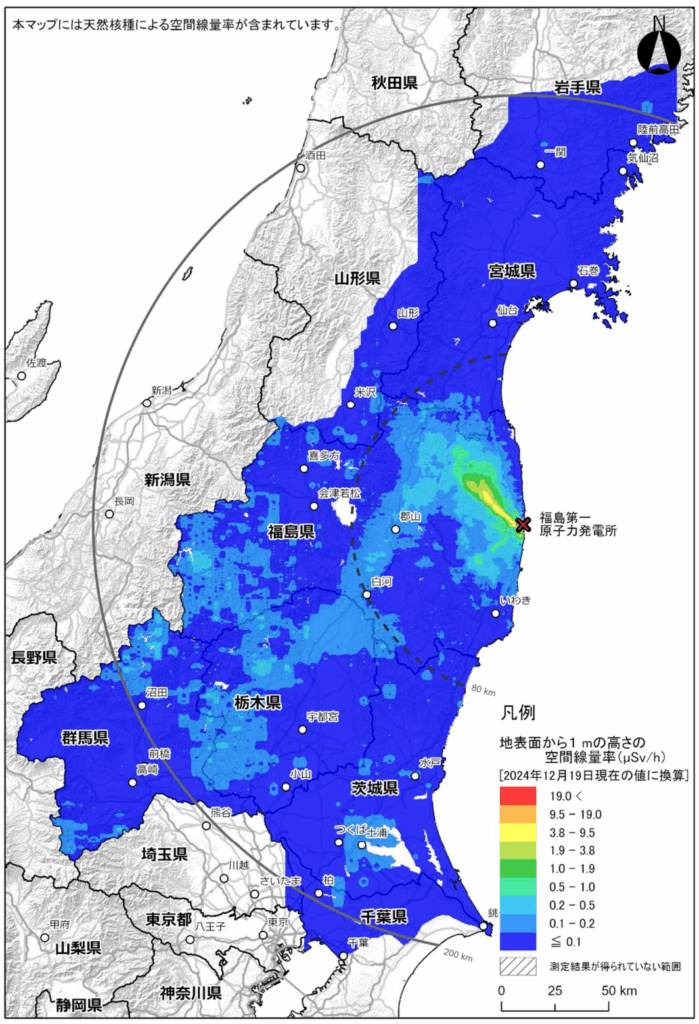
↑ 19 Dec. 2024
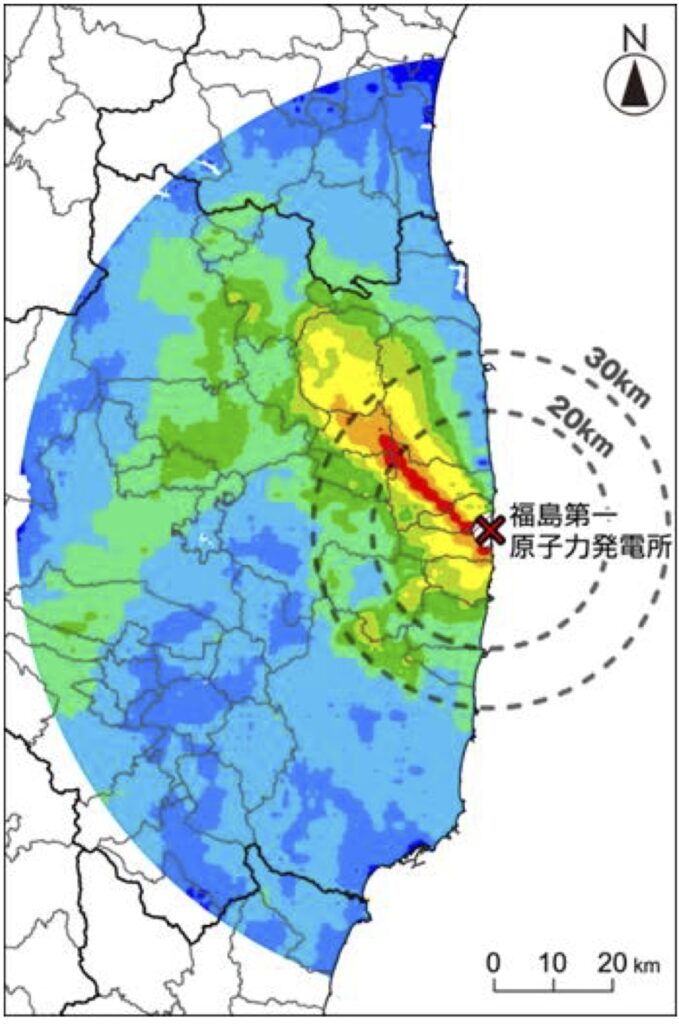
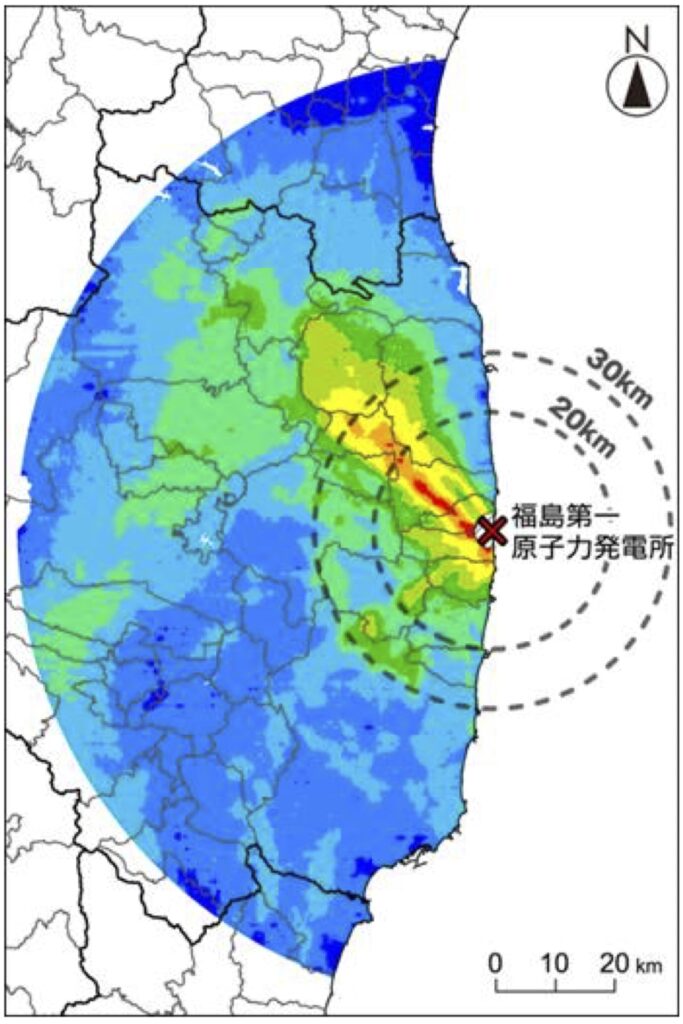
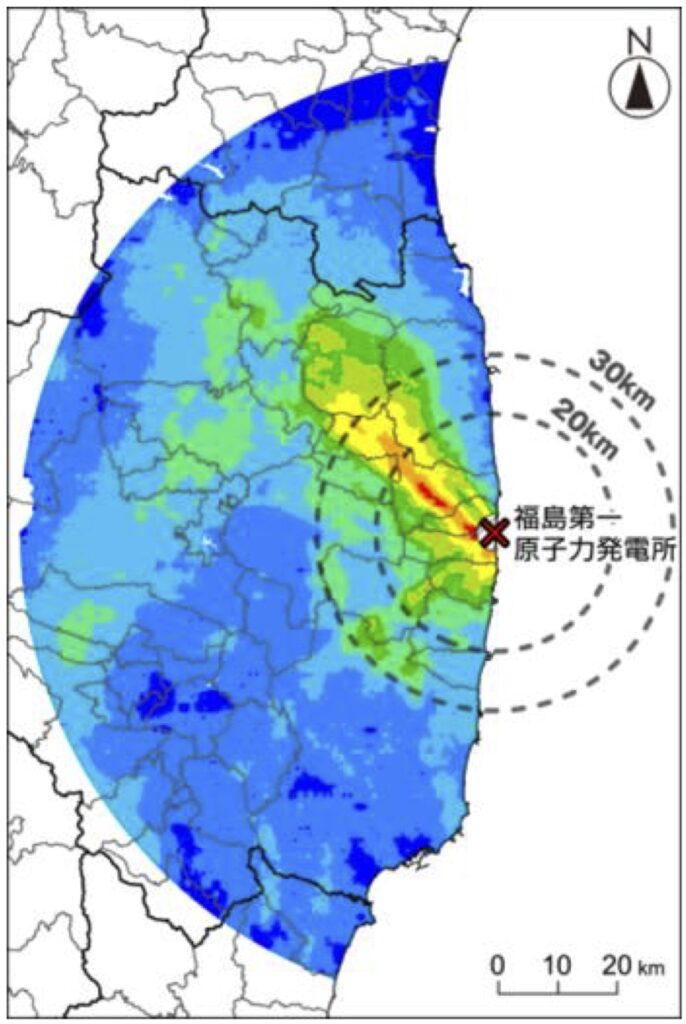
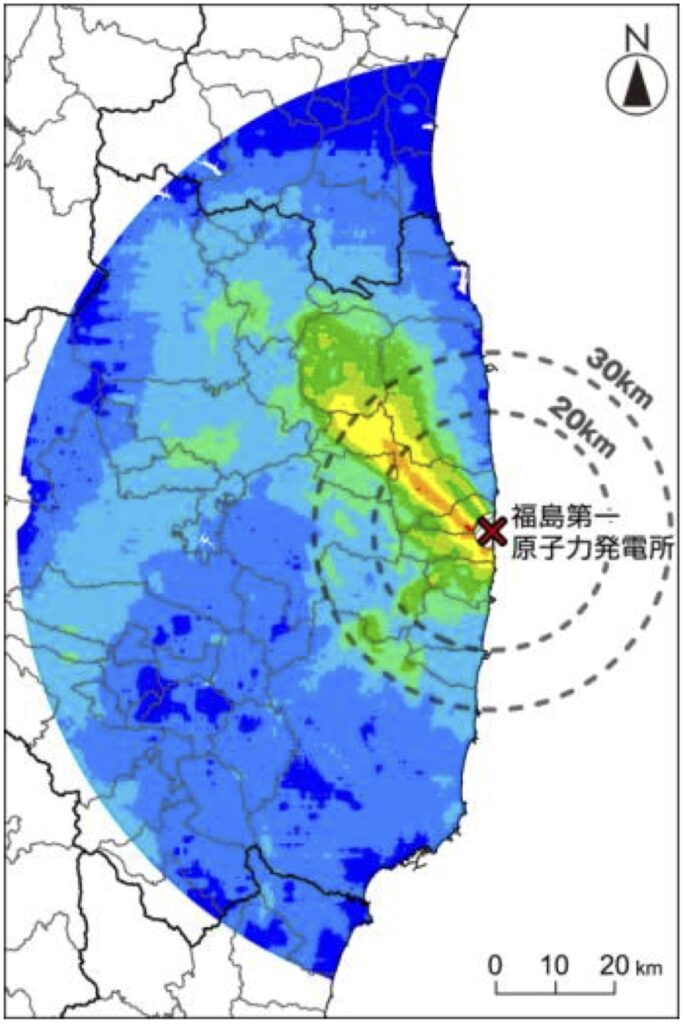
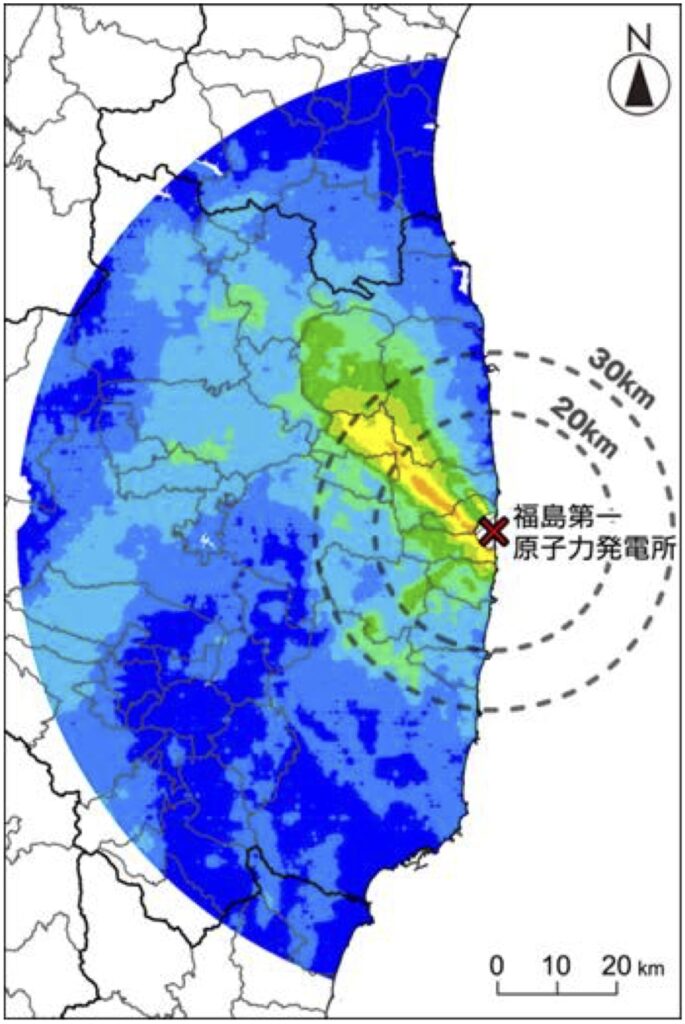
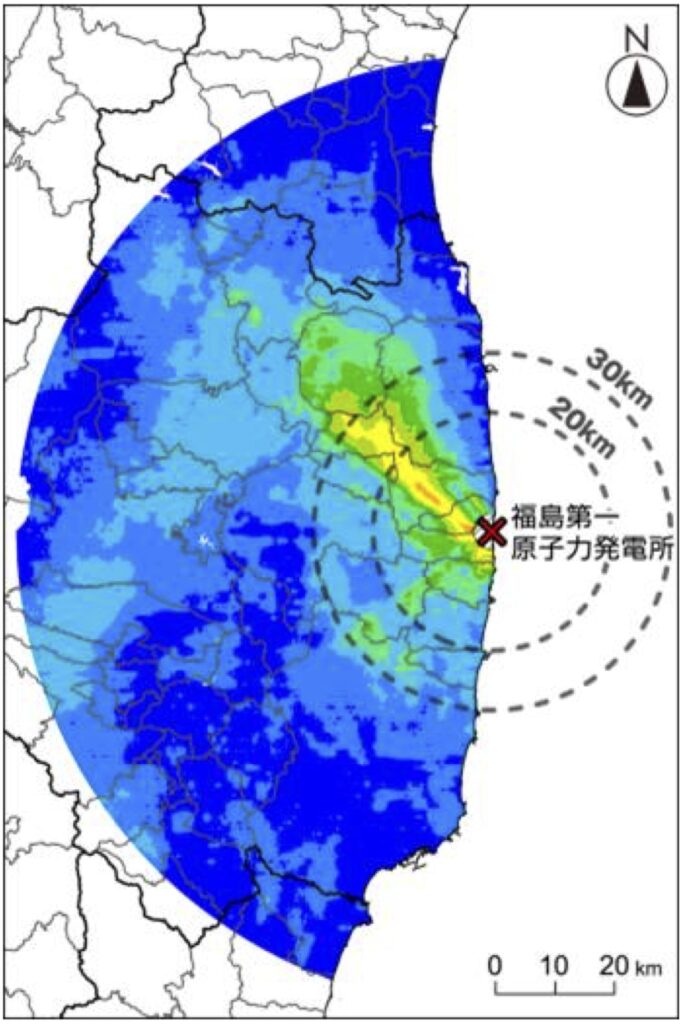
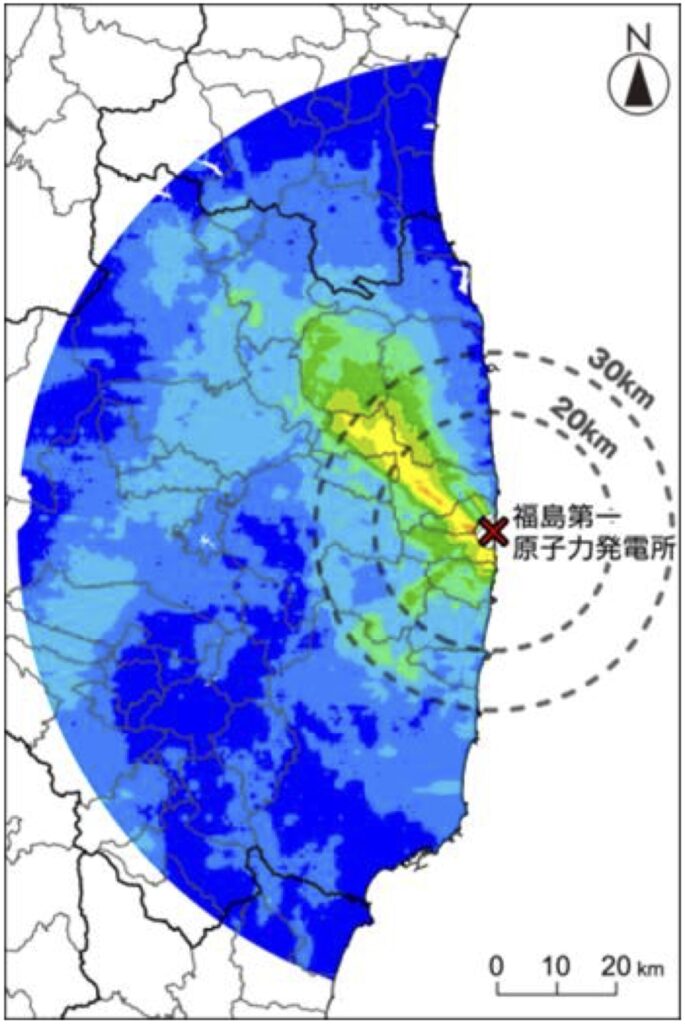
Change of air dose rate with time (Vicinity of the Fukushima Daiichi NPP)
Results of air-borne monitoring in the vicinity of the Fukushima Daiichi NPP (within 80km) are available, starting from the results of April 2011, when around 1 month passed after the accident.
They are omitted, but the legend of figures are same with the abovementioned results of the East Japan in each year.
That means, that red area represents high air dose rate, and it decreases from high to low: orange, green to blue.
As mentioned above, after the accident, methodology for monitoring, as well as approach for evaluation have been improved, as time has proceeded, therefore, it might be better to see general change or tendency of change of air dose rate, instead of focusing on change of too much small/local areas.
What can be observed from results of the around 12-year monitoring projects are summarized in the last part of this article.
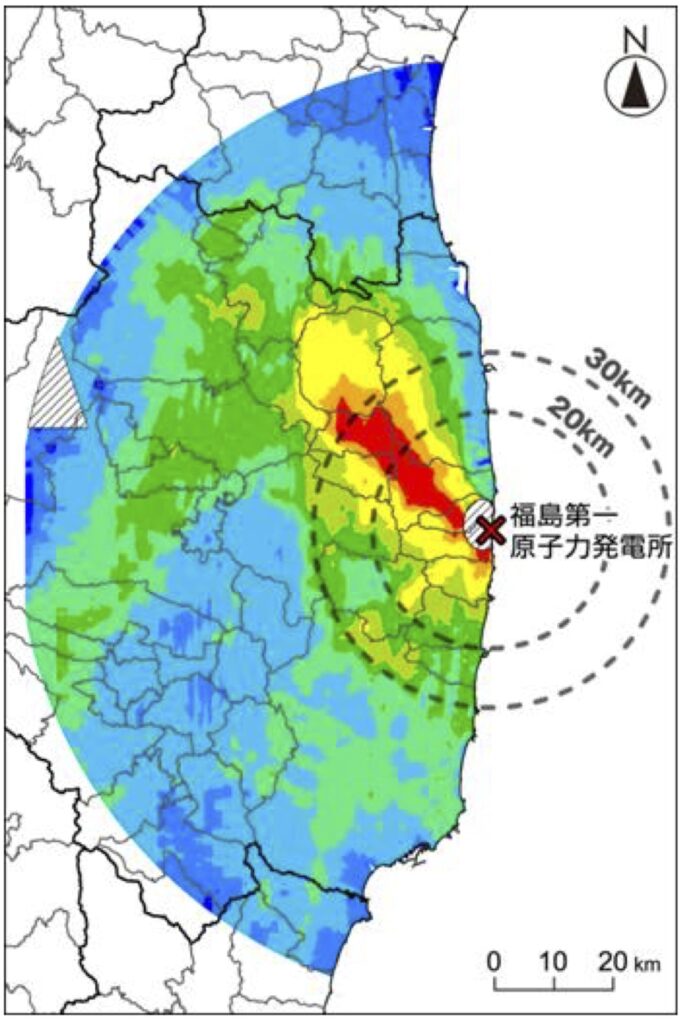
↑ 29 Apr. 2011
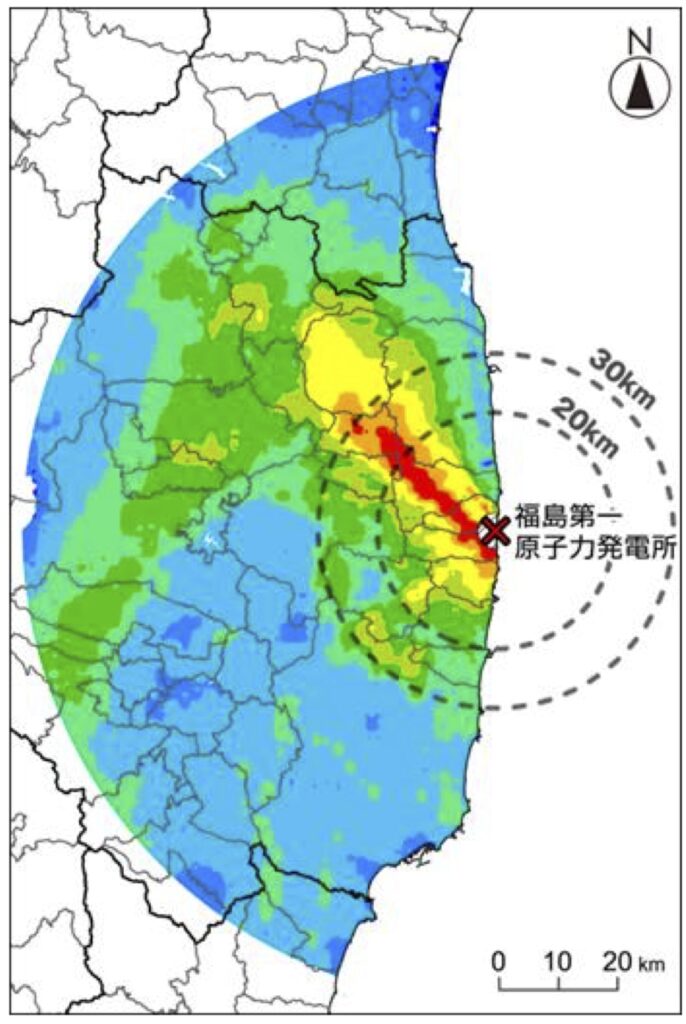
↑ 5 Nov. 2011
↑ 28 Jun. 2012

↑ 16 Nov. 2012
↑ 28 Sep. 2013
↑ 29 Sep. 2014
↑ 29 Sep 2015
↑ 15 Oct. 2016

↑ 25 Sep. 2017

↑ 16 Oct. 2018
↑ 18 Sep. 2019
↑ 2 Oct. 2020
![]()
↑ 25 Oct. 2021
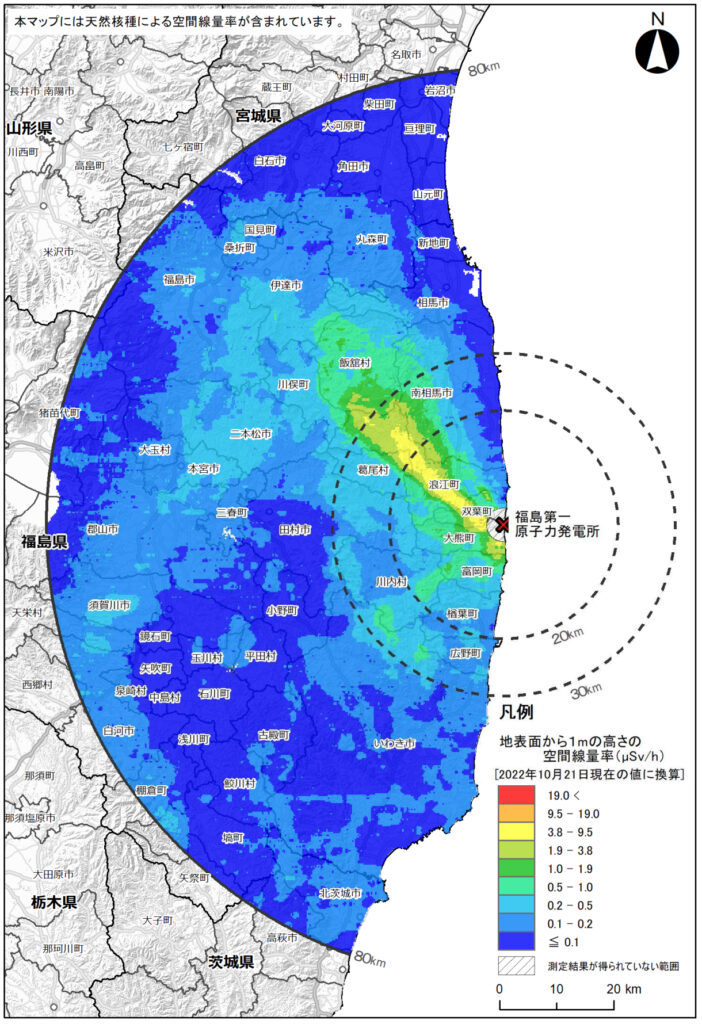
↑ 21 Oct. 2022
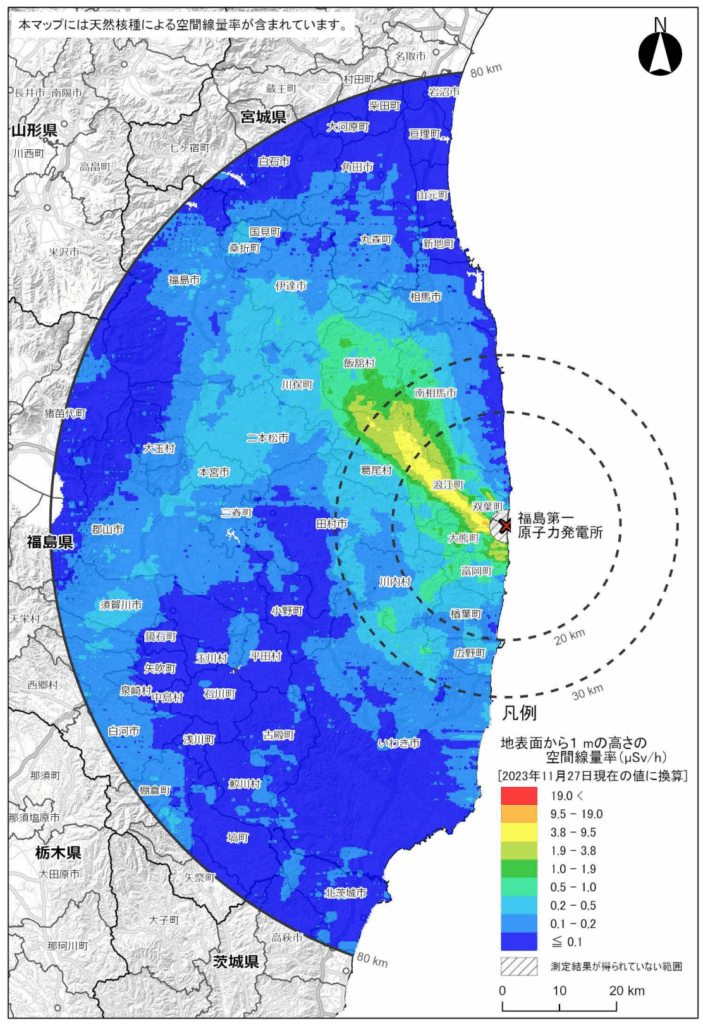
↑ 27. Nov. 2023

↑ 19. Dec. 2024
What can be found out from results of airborne monitoring?
What can be understood based on the abovementioned results of air-borne monitoring are as follows:
Contamination spreads from Tohoku to Kanto
Of course it depends on each region, but contamination spreads out from the Tohoku region like the Iwate Prefecture, to the Kanto region like the Chiba Prefecture.
The contamination could spread farther to the areas which are not covered by the air-borne monitoring, because released radioactive materials would not be completely stopped at borders between prefectures, although it could be possible, for clouds with released radioactive materials to be a bit stalled there, due to obstacles like mountains.
Level of impact, however, varies from places to places, but basically the farther it gets from the Fukushima Daiichi Nuclear Power Plant, the less the impact becomes, as explained below.
Air dose rate decreases as a whole with time

This is the very basic, but obviously air dose rate has decreased as a whole with time.
Red or yellow areas shortly after the accident turned into green or blue with time, and light blue areas also turned into darker blue.
On the other hand, if looking into detail, in the quite small part of areas with low air dose rate (blue), apparently air dose rate increased slightly and temporarily, after some time passed.
Possibility that air dose rate actually slightly increases can’t be excluded, but basically this phenomena could attribute to the change or improvement of methodologies of monitoring and its evaluation, as mentioned at the beginning of this article.
Especially categories of air dose rate in blue areas are divided very finely, so I think the phenomena could possibly happen, according to the change of methodologies of monitoring and its evaluation.
Reduction rate of air dose rate is large in areas with high dose rate

Air dose rate has decreased as a whole as mentioned above, but its reduction rate apparently differs from points to points.
Specifically, in the areas where air dose rate was originally high (e.g. red or orange area), reduction rate is also high, but in the areas where air dose rate war originally low (e.g. blue), reduction rate is also comparatively low.
Reasons why these phenomenon occur will be touched upon in this article.
Air dose rate becomes higher when it comes closer to the NPP and lower when it comes farther from the NPP, but there are a lot of exceptions
Radioactive materials released after the accident of the Fukushima Daiichi Nuclear Power Plant, were partially deposited through direct contact of plume, which contains the radioactive materials, with objects on the ground, or partially sometimes through rainfall.
Nevertheless, it can be intuitively understood, that more radioactive materials tend to be deposited on the points, which locate closer to point of release.
In addition, as touched upon in this article, there are some radioactive materials, released after the accident of the Fukushima Daiichi Nuclear Power Plant, with less volatility and deposited onto the ground in the vicinity of the plant.
Radioactive materials, with high volatility, however, travel far and deposit onto the ground, especially according to wind direction, as well as condition of precipitation.
As results of physical, chemical conditions as well as meteorological phenomenon mentioned above, air dose rate was likely to become higher, when it came closer to the Fukushima Daiichi Nuclear Power Plant, but it didn’t spread in a concentric manner but it showed some area difference.
In the north-west of the Fukushima Daiichi Nuclear Power Plant, air dose rate became higher, for example, as a result of wind direction at that time.
Reduction rate of air dose rate decreases with time
Another observed tendency is reduction rate of air dose rate itself has decreased with time.
It is easier to understand this phenomena, if comparing a couple of figures shortly after the accident with the figures of the most recent few years.
It can be easily identified, that air dose rate plummeted shortly after the accident: for example, in the north-west area of the Fukushima Daiichi Nuclear Power Plant, the red and orange areas were rapidly reduced.
It is also easily identified, that in the dark blue expanded, replacing light blue areas.
As time went by, however, no big difference could not be seen.
Especially, even if comparing figures in the most recent a few years, it seems to be difficult to identify the difference between them.
Reasons why such phenomena occurred will be elaborated in this article.
Summary
This time extent of environment contamination and its following change over time after the accident of the Fukushima Daiichi Nuclear Power Plant was elaborated.
Main points are as follows:
– Contamination spreads from Tohoku to Kanto
– Air dose rate decreases as a whole with time
– Reduction rate of air dose rate is large in areas with high dose rate
– Air dose rate becomes higher when it comes closer to the NPP and lower when it comes farther from the NPP, but there are a lot of exceptions
– Reduction rate of air dose rate decreases with time
By the way, abovementioned contents are summarized in the following videos.
It would be appreciated to visit them at your convenience.
– Japanese version
– English version
You can read the same article in Japanese here.
Thank you very much for reading this article.
See you next time!

コメント